by Emiliano Chitti | Aug 14, 2024 | Tips
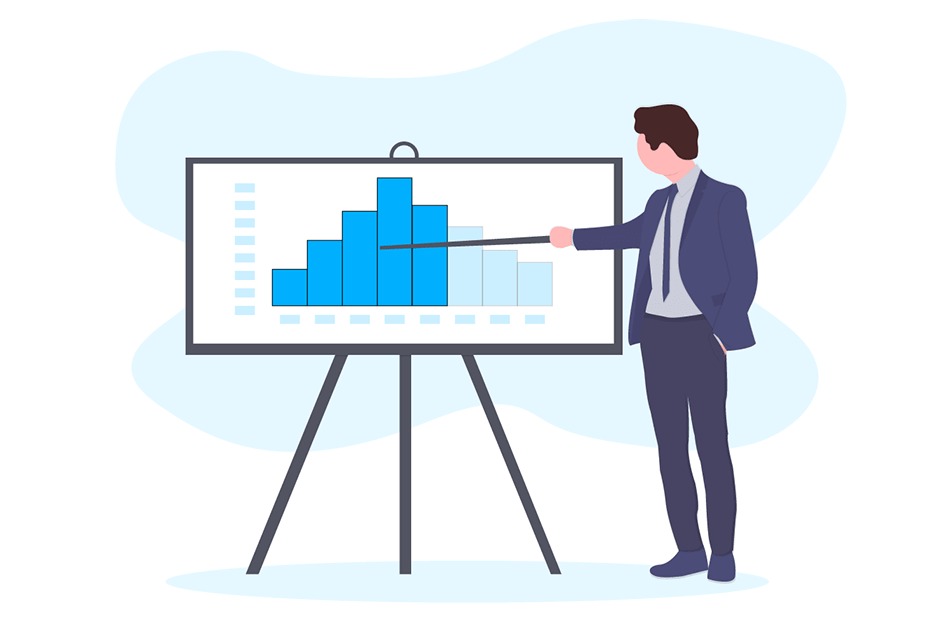
A histogram is a graphical tool used in dashboards to represent the distribution of a data set. It is essential when you want to visualize how data is grouped into specific intervals, allowing you to detect patterns and trends in your data.
by Emiliano Chitti | Aug 14, 2024 | Technology
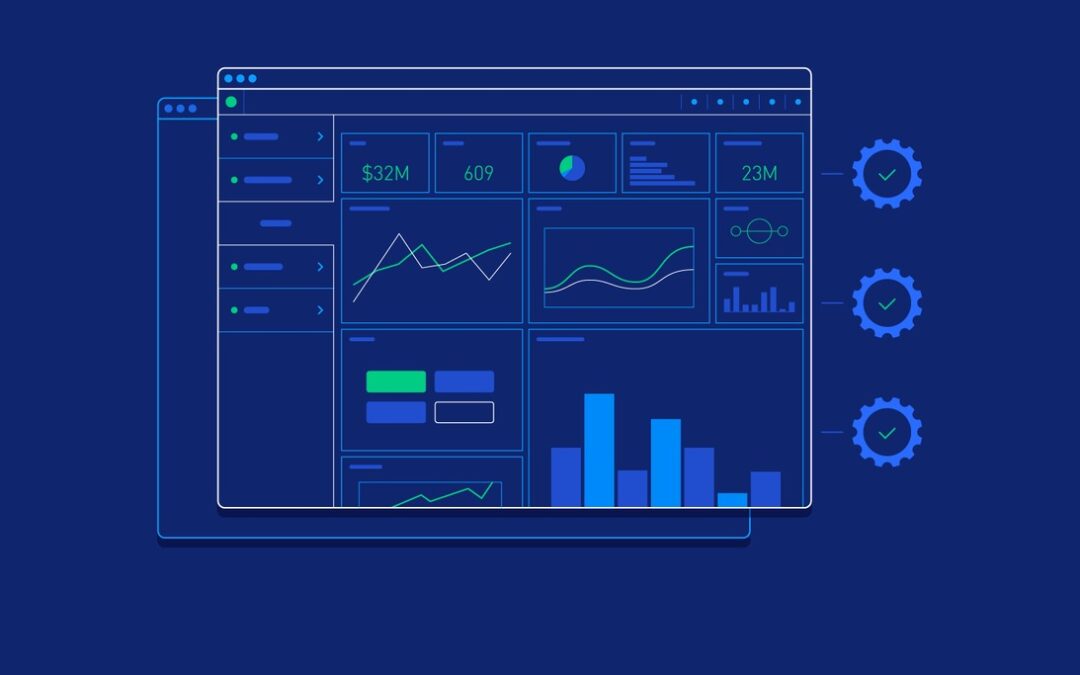
A dashboard, also known as a control panel, is a visual tool that allows you to monitor, analyze and present key information in a clear and concise manner. These dashboards are used to track the performance of various metrics and KPIs (Key Performance Indicators)....


Recent comments