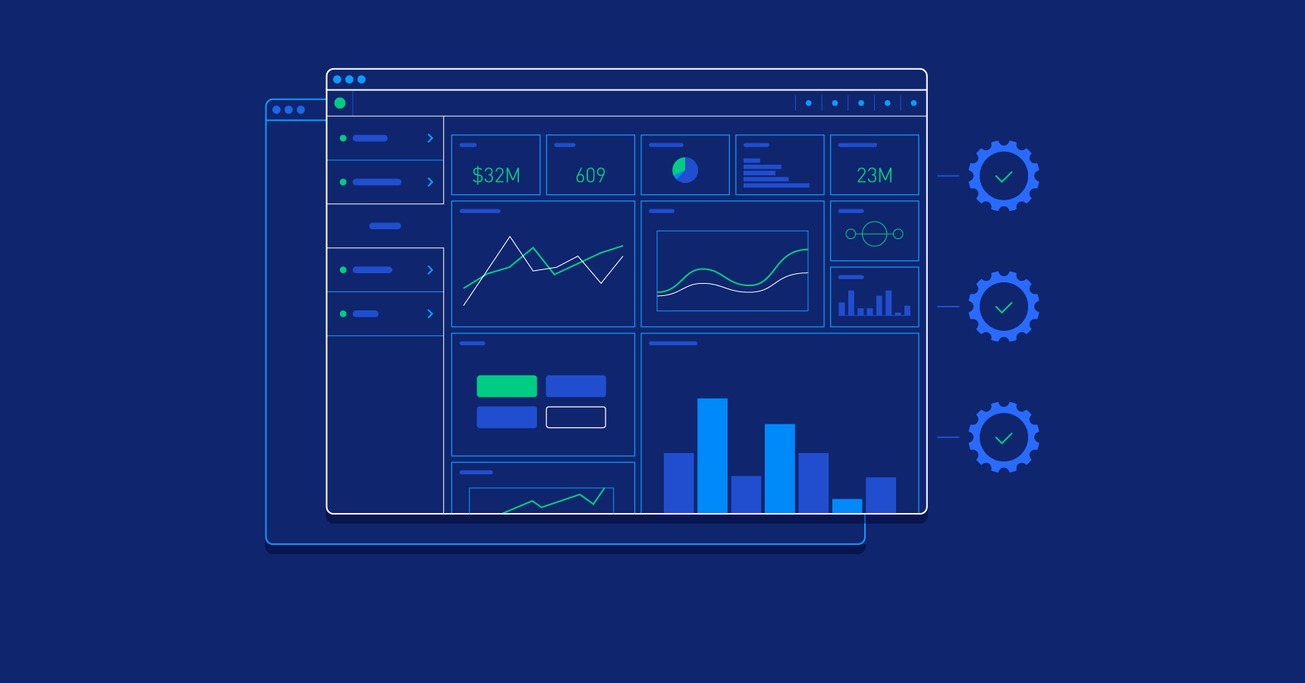
A dashboard, also known as a control panel, is a visual tool that allows you to monitor, analyze and present key information in a clear and concise manner. These dashboards are used to track the performance of various metrics and KPIs (key performance indicators) in real time, facilitating informed decision making in different areas such as business, marketing, finance, and more.
Features
- Data visualization: A dashboard converts complex data into easy-to-understand graphs and charts, allowing you to identify trends, patterns and areas that require immediate attention.
- Real-time updateDashboards are usually updated automatically, providing real-time data for faster and more accurate decision making.
- Customization: They can be tailored to the user's needs, displaying only the most relevant information and organizing it in a way that is easy to interpret.
- Interactivity: Many dashboards allow the user to interact with the data, filtering and exploring specific details for deeper insights.
Advantages
- Improved decision making: By providing a clear, real-time view of important data, a dashboard enables more informed and timely decisions.
- Time saving: Aggregates and synthesizes information from various sources in one place, saving time in the search and analysis of dispersed data.
- Opportunity identification: Facilitates the detection of opportunities and risks by highlighting patterns and anomalies that might go unnoticed in traditional reports.
- Effective communication: Being highly visual, it facilitates the communication of results and analysis to different teams within an organization.
Types of Dashboards
- Operational: Used to monitor daily operations and ensure that everything is running as it should.
- Analytics: Helps users analyze historical trends and performance.
- Strategic: Focused on the general vision of the company and its alignment with long-term objectives.
- Tactical: Designed to manage specific projects or campaigns, with emphasis on monitoring and meeting short-term goals.
A dashboard is a powerful tool that transforms raw data into valuable information, allowing users to monitor performance and make informed decisions efficiently. If you're thinking of implementing a dashboard, the best way to get started is to use a template. And with MasterMetrics, you can get one for free!


