(9)")
Manejar varias cuentas a veces puede ser todo un desafío para quienes estamos en el mundo del marketing; la visualización de datos, la recolección de los mismos, qué kpi´s elegir son uno de los varios ejemplos de desafíos a los que nos enfrentamos cada día.
Por suerte en Master Metrics contamos con una función que nos permite ver todos los datos de todas nuestras cuentas en un mismo lugar. El modulo Overview te permite ver en una tabla unificada información de varias cuentas publicitarias y así evitar tener que navegar por varios reportes o plataformas publicitarias
Hay 2 tipos de visualización: Por cliente o por campaña, según lo que más necesites.
1) Por Cliente
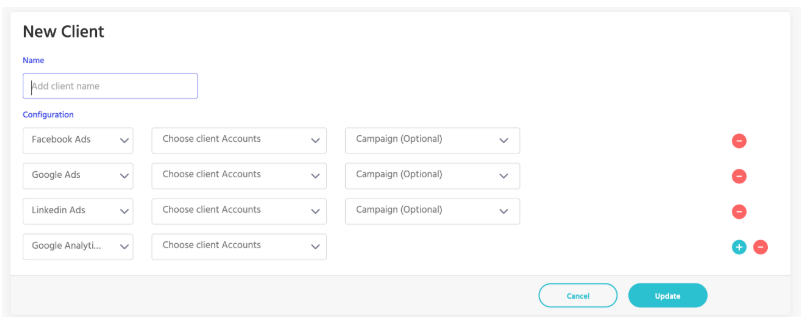
Podes configurar cada cliente eligiendo la cuenta publicitaria para cada plataforma y opcionalmente agregarle un filtro en las campañas.
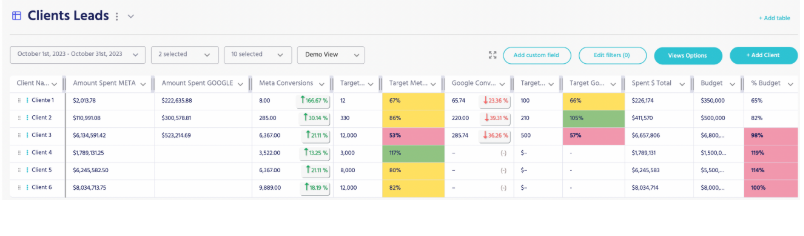
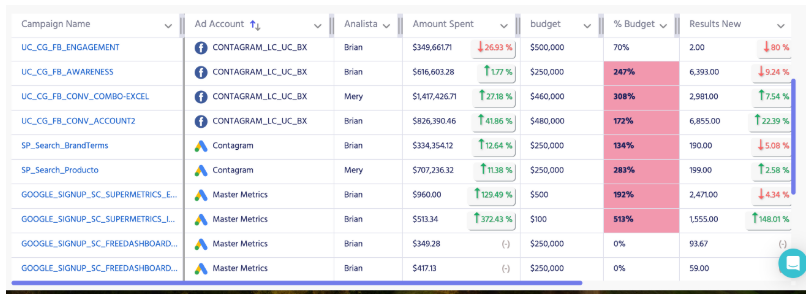
Una vez creado cada cliente podes ver en una tabla toda la info de tus clientes toda junta (de Meta, Google, Linkedin, etc) y ver como vienen:
– estamos cumpliendo con el presupuesto?
– como venimos contra los objetivos?
– como progreso vs el periodo anterior?
Al momento de crear un cliente podes utilizar el filtro de campañas para desglosar ese cliente:
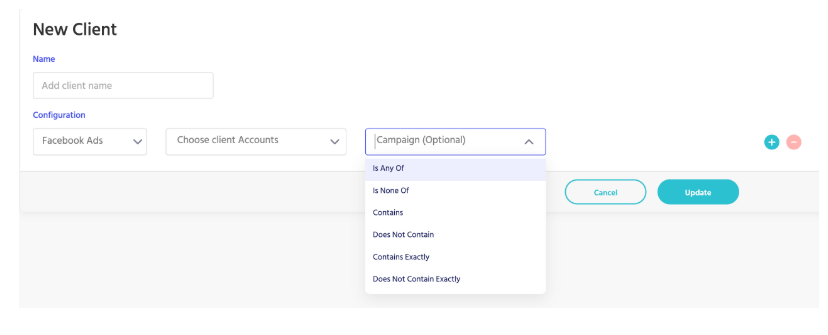
Ejemplos:
- si filtro campañas de performance vs campañas de branding podria poner en la tabla 2 clientes. «Cliente A Performance» y «Cliente B Branding»
- si filtro campañas por region podria poner en la tabla N clientes, uno por cada region: «Cliente Region A», «Cliente Region B», «Cliente Region C», etc
- si vendo dos productos o servicios distintos en una misma cuenta publicitaria, podria utilizar los filtros de campañas para desglosar al cliente segun la unidad de negocios correspondiente
Para crear una tabla nueva lo primero que tenes que hacer es agregar a los clientes con sus respectivas plataformas y cuentas publicitarias:
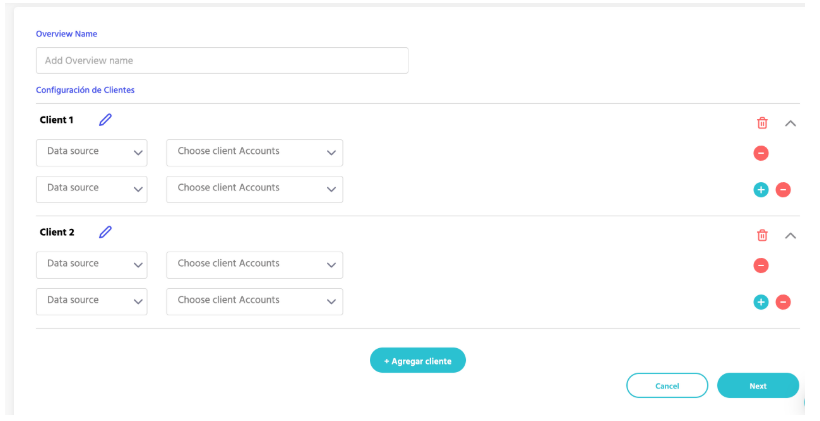
No hace falta que agregues todos los clientes en este modal ya que podes agregar clientes adicionales o editar los mismos mas adelante.
Podes crear todas las tablas que quieras! podrias armar una tabla para cuentas de ecommerce y una segunda tabla para cuentas de generacion de leads. O sino una tabla para los clientes de un analista particular, etc.
Una vez que hayas agregado los primeros clientes en el modal anterior, vas a poder elegir crear la tabla de cero o utilizando un template
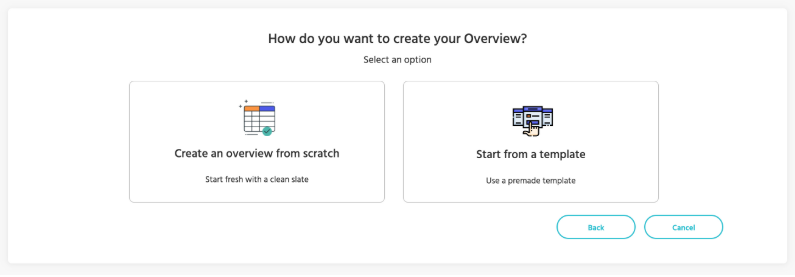
Dependiente lo que necesites podes elegir uno de los templates prearmados y después editar los mismos en funcion a tus necesidades
En el siguiente artículo explico como crear una tabla de cero y como funciona cada uno de sus componentes
2) Por Campaña
La tabla por campaña te permite ver campañas de distintas plataformas como Meta, Google, Linkedin, etc, en una misma tabla para varias cuentas publicitarias. Por ende, si tenes que estar mirando los datos de cada campaña para varias cuentas, es mucho mas fácil verlo todo unificado en una tabla que tener que ir a verlo a cada plataforma publicitaria
Crea objetivos y revisa visualmente como te esta yendo vs data real:
- Campaña XYZ de Meta esta 20 % sobre el presupuesto
- Campaña ABC de Google esta 5 % abajo del objetivo de ventas diario $
- Campaña XDF de Linkedin esta 30 % abajo del target en conversiones diarias
- Campaña MNJ de Google esta 10 % arriba del target en las conversiones semanales
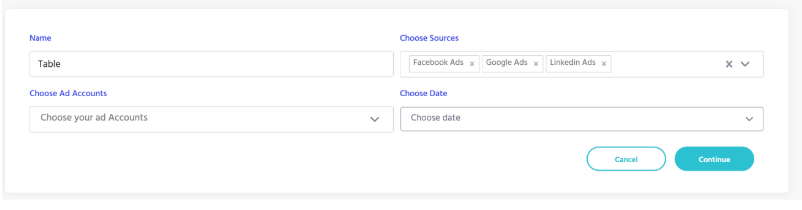
Al momento de crear una tabla tenes que elegir las plataformas, las cuentas publicitarias y la fecha que requeris para la data:
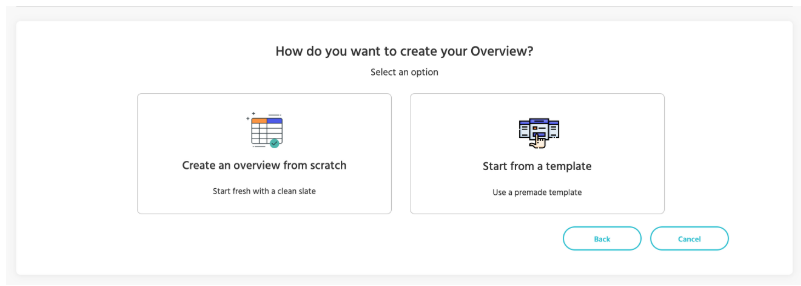
El siguiente paso es elegir si queres crear la tabla de cero o partir desde un template:
,
Una vez hayas seguido estos pasos ya vas a poder monitorear todas tus campañas o cuentas desde un mismo lugar.