(9)")
Managing multiple accounts can sometimes be quite a challenge for those of us in the marketing world; data visualization, data collection, which kpi's to choose are just one of several examples of challenges we face every day.
Fortunately in Master Metrics we have a feature that allows us to see all the data from all our accounts in one place. The Overview module allows you to see in a unified table information from several advertising accounts and thus avoid having to navigate through several reports or advertising platforms
There are 2 types of visualization: By client or by campaign, depending on what you need most.
1) Per Customer
You can configure each client by choosing the advertising account for each platform and optionally add a filter in the campaigns.
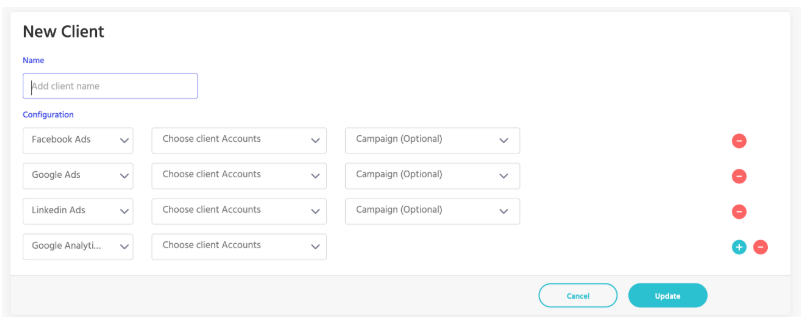
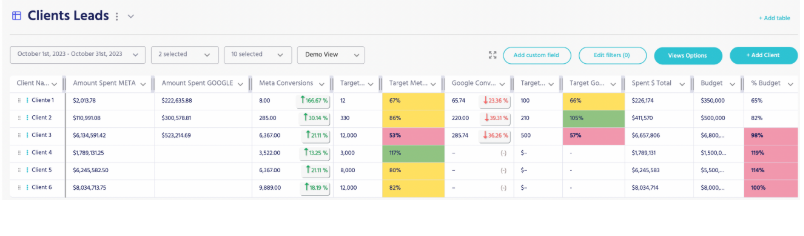
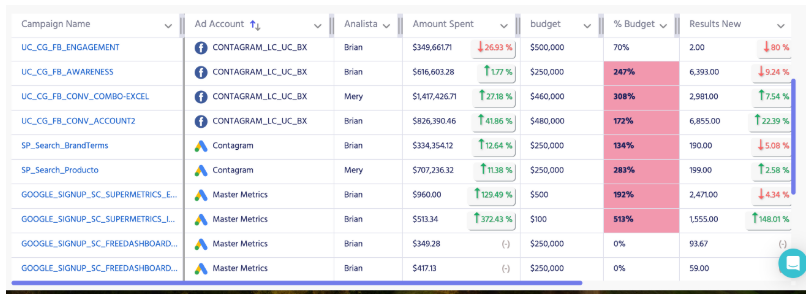
Once you have created each client you can see in a table all your clients' info all together (from Meta, Google, Linkedin, etc) and see how they are doing:
- are we on budget?
- how are we doing against targets?
- how are we doing vs. previous period?
When creating a client you can use the campaign filter to drill down to that client:
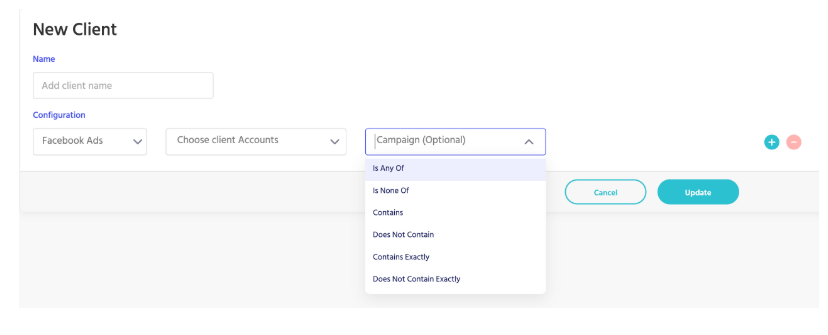
Examples:
- if I filter performance vs branding campaigns I could put in the table 2 clients. "Client A Performance" and "Client B Branding".
- if I filter campaigns by region I could put in the table N clients, one for each region: "Client Region A", "Client Region B", "Client Region C", etc.
- if I sell two different products or services in the same advertising account, I could use the campaign filters to break down the customer according to the corresponding business unit.
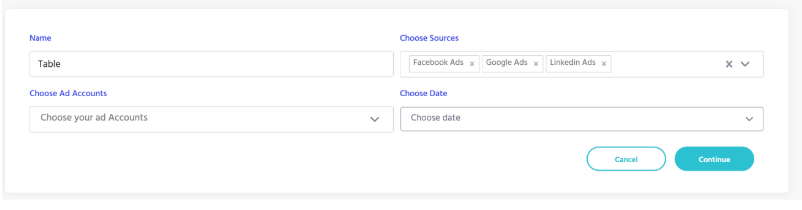
To create a new table the first thing you have to do is to add the clients with their respective platforms and advertising accounts:
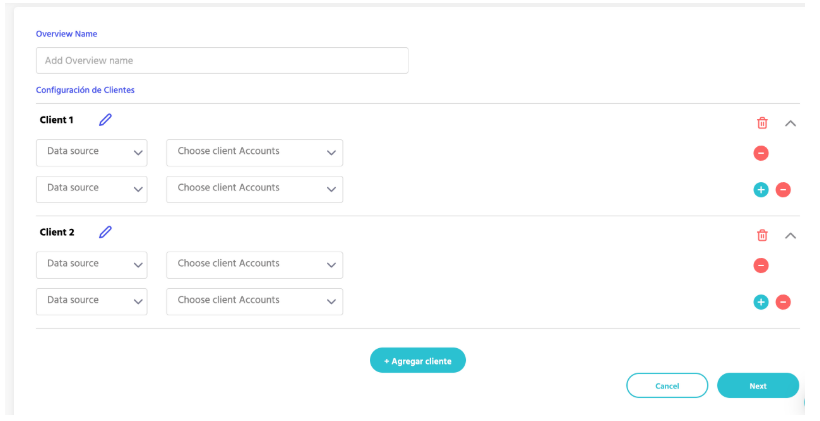
You do not need to add all clients in this modal as you can add additional clients or edit them later.
You can create as many tables as you want! You could create a table for ecommerce accounts and a second table for lead generation accounts. Or else a table for a particular analyst's clients, etc.
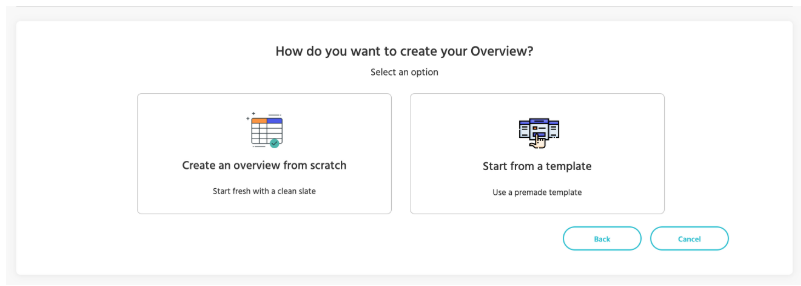
Once you have added the first customers in the previous modal, you can choose to create the table from scratch or using a template.
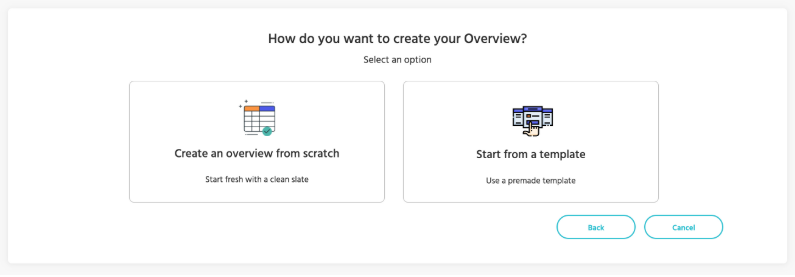
Depending on what you need, you can choose one of the pre-made templates and then edit them according to your needs.
In the following article I explain how to create a table from scratch and how each of its components works.
2) By Campaign
The table by campaign allows you to see campaigns from different platforms such as Meta, Google, Linkedin, etc, in the same table for several advertising accounts. Therefore, if you have to be looking at the data of each campaign for several accounts, it is much easier to see it all unified in one table than having to go to each advertising platform to see it.
Create objectives and visually review how you are doing vs. actual data:
- Target XYZ campaign is 20% over budget.
- Google's ABC campaign is 5% below daily sales target $
- Linkedin XDF campaign is 30% below target in daily conversions.
- Google's MNJ campaign is 10% above target in weekly conversions.
When creating a table you have to choose the platforms, the advertising accounts and the date you require for the data:
The next step is to choose whether you want to create the table from scratch or start from a template:
,
Once you have followed these steps you will be able to monitor all your campaigns or accounts from one place.