by Emiliano Chitti | Aug 14, 2024 | Tips
The SWOT (Strengths, Weaknesses, Opportunities and Threats) analysis is a fundamental strategic tool used by companies and organizations to evaluate their current situation and plan for the future. This analysis makes it possible to identify both the factors...
by Emiliano Chitti | Aug 14, 2024 | Tips
LinkedIn impressions are a key concept for measuring the performance of your posts on this professional network. If you are looking to improve your LinkedIn presence, it is essential to understand how impressions work and what they mean for your strategy. What...
by Emiliano Chitti | Aug 14, 2024 | Tips
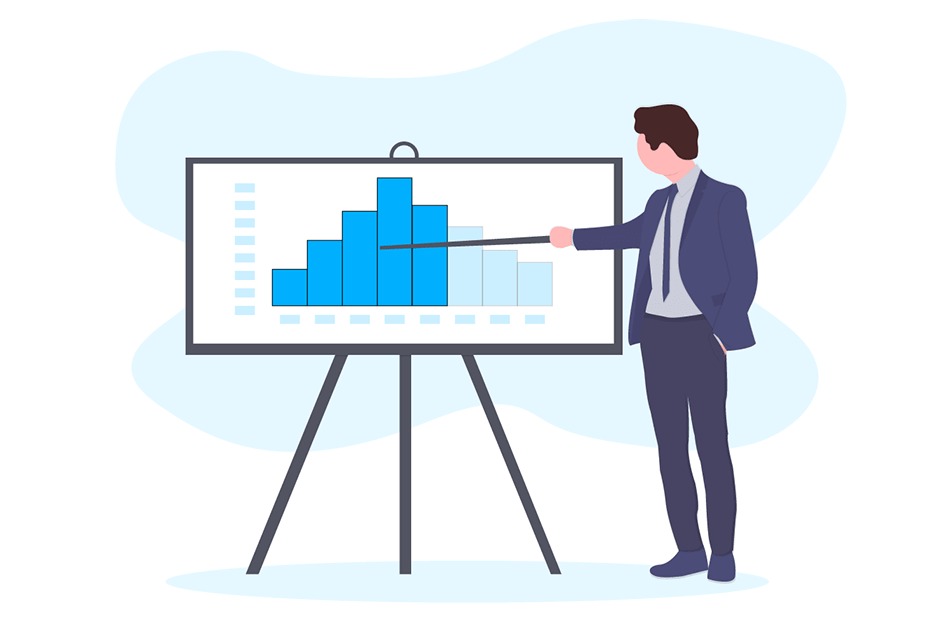
A histogram is a graphical tool used in dashboards to represent the distribution of a data set. It is essential when you want to visualize how data is grouped into specific intervals, allowing you to detect patterns and trends in your data.
by Emiliano Chitti | Jul 25, 2024 | Tips
Threads, Meta's new app, has burst onto the social networking scene as an alternative to X (formerly Twitter), offering a microblogging platform focused on quick and direct conversations. Let's break down what Threads is and why it's...
by user | Jul 25, 2024 | Tips
Pinterest Academy is a free educational platform designed to help marketers and content creators get the most out of Pinterest. It offers interactive courses that cover everything from Pinterest basics to strategies for...
by Emiliano Chitti | Jul 25, 2024 | Tips
TikTok is a great place to discover catchy music, and sometimes you want to save those tracks for later listening. Although TikTok does not allow you to download the songs directly, there are several methods to do so and we are going to tell you all about them. Here's how you can...


Recent comments